Case study 02
Sezlik: home search for Ottawa’s top team
A full real estate website for Sezlik.com, a Royal LePage team in Ottawa: listing search, property pages, a home value tool and a private area for registered clients.
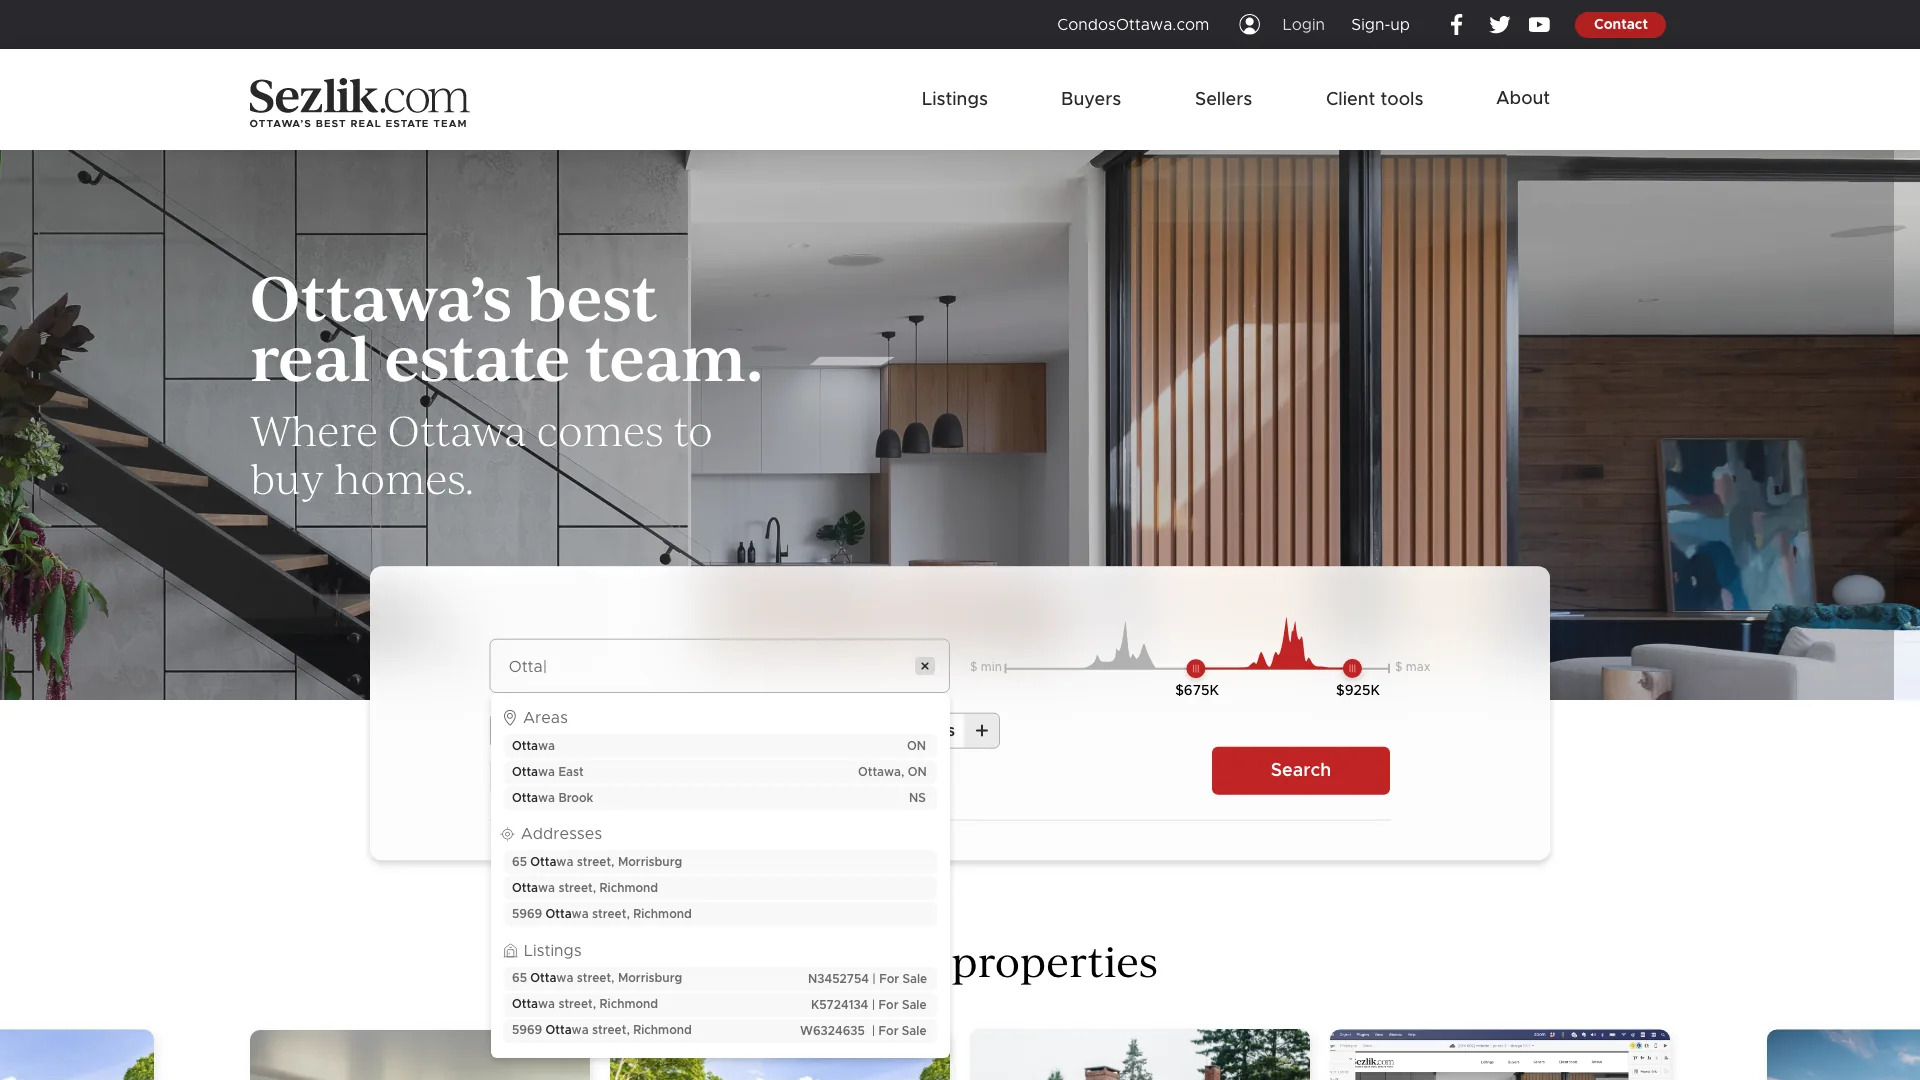
The problem
Most Ottawa buyers start their search on the big national portals. Sezlik, one of the city’s leading teams, wanted its own site to be the better place to search: every MLS listing plus the team’s exclusive ones, local market data, and tools that only registered clients get.
For the team, the site had a second job: turn anonymous visitors into clients the agents know something about.
The constraints
Listings come from two feeds with different rules. Public DDF listings can be shown to anyone. VOW data, with fuller details and sold history, may only be shown to signed-in users. Every search view and property page had to work in both states, on desktop, tablet and phone.
What I did
As the only designer, I worked with the product manager and developers from the service model to the final UI:
- A service blueprint of the whole journey, from first search to the agent’s call
- The site map and key flows for buyers and sellers
- An analytics model: which market data clients see, and which signals reach the team
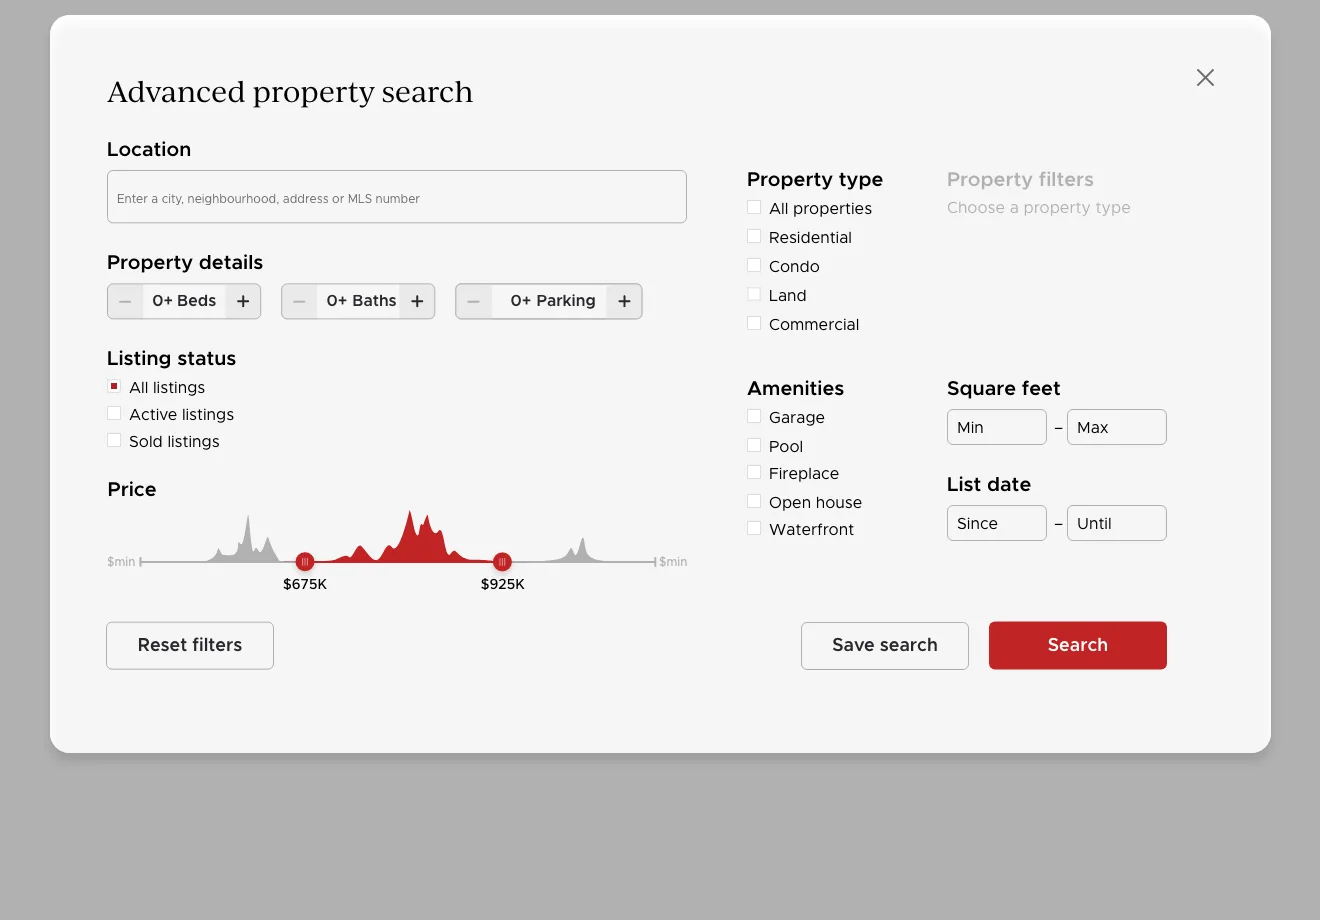
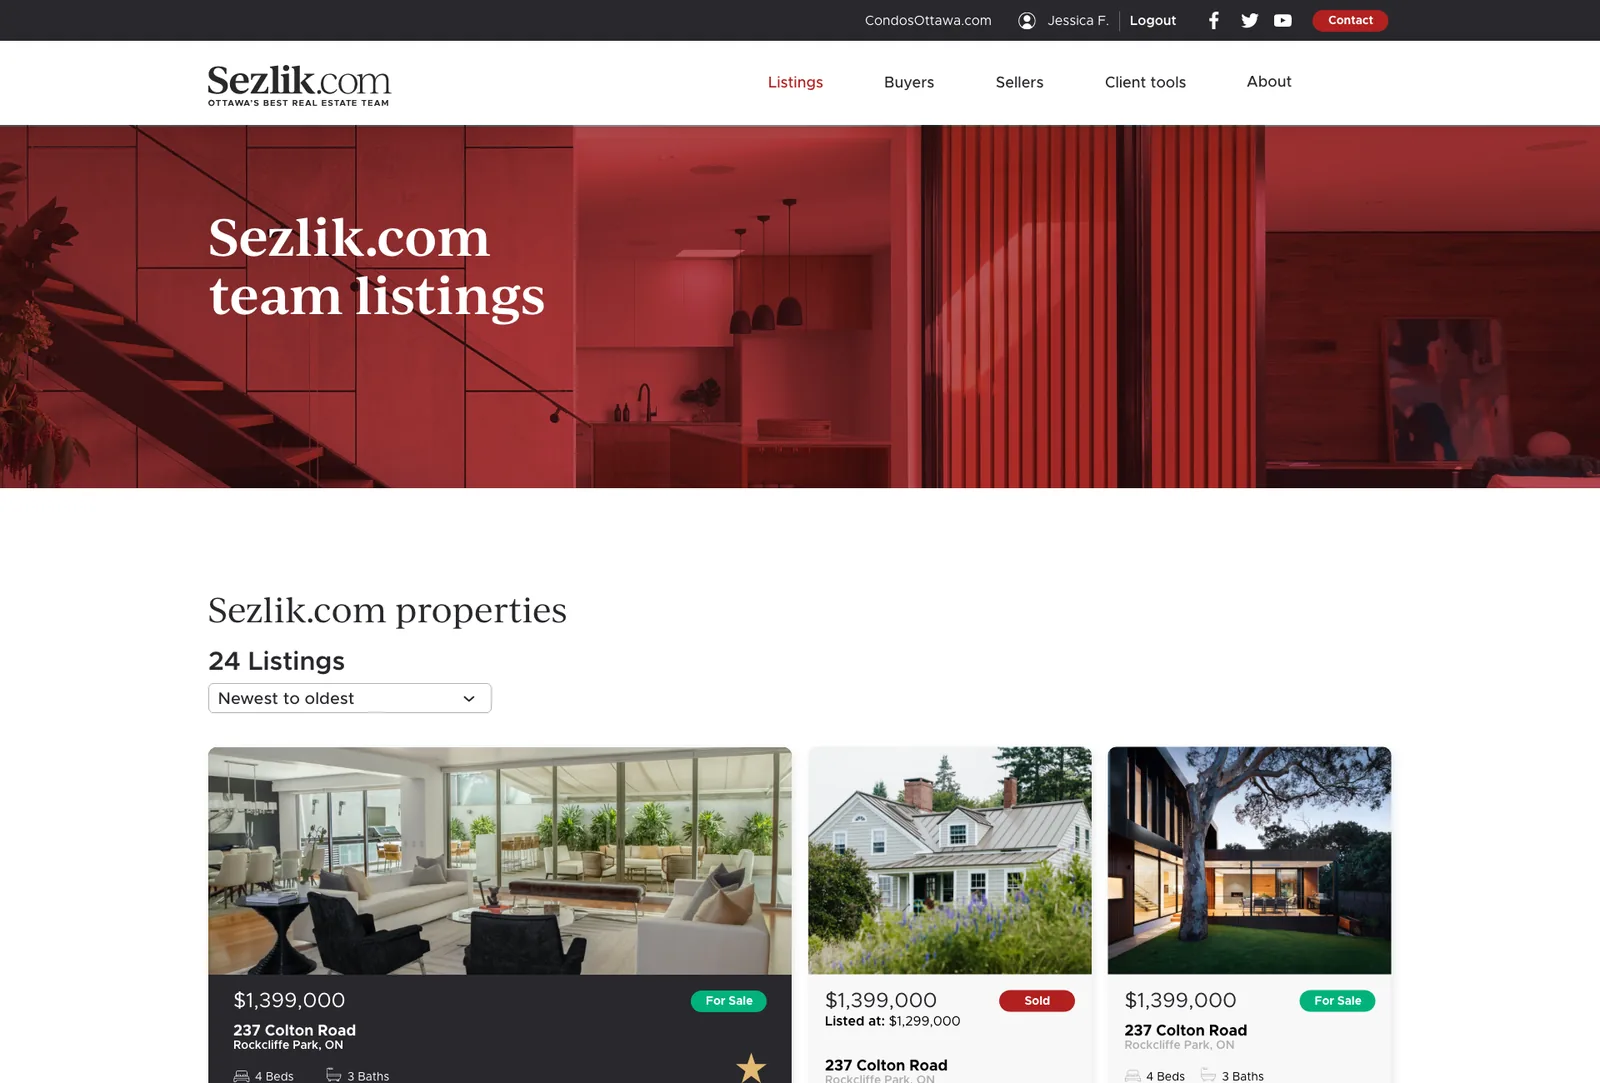
- Listing search in gallery, map and table views, with advanced filters
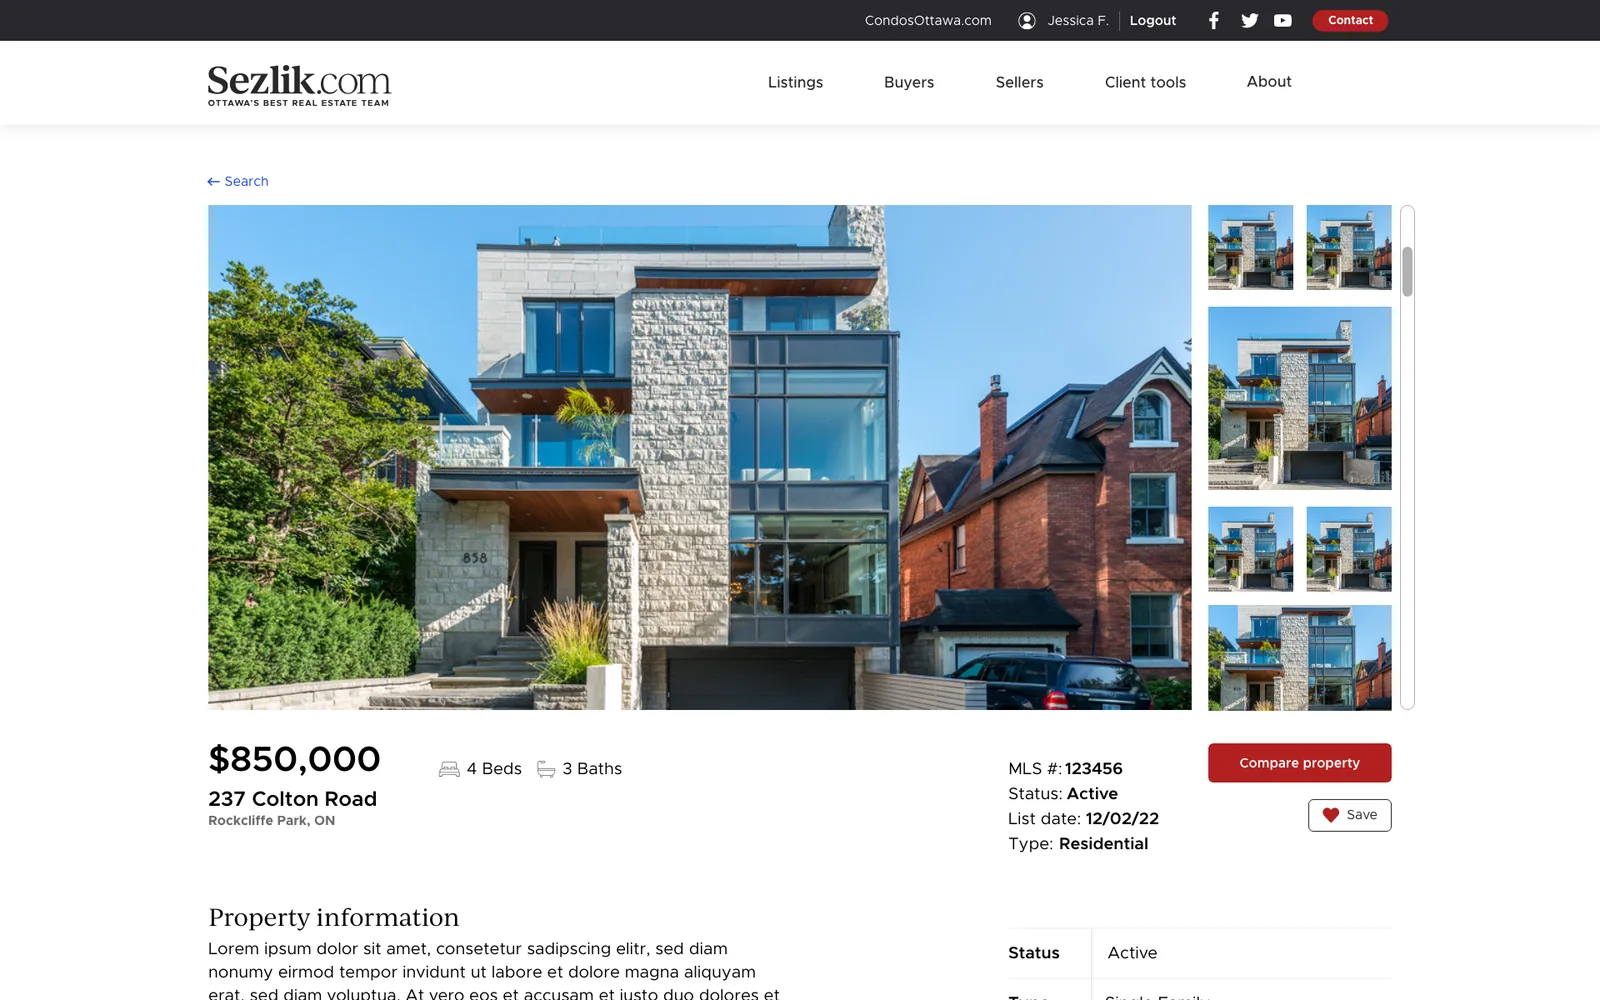
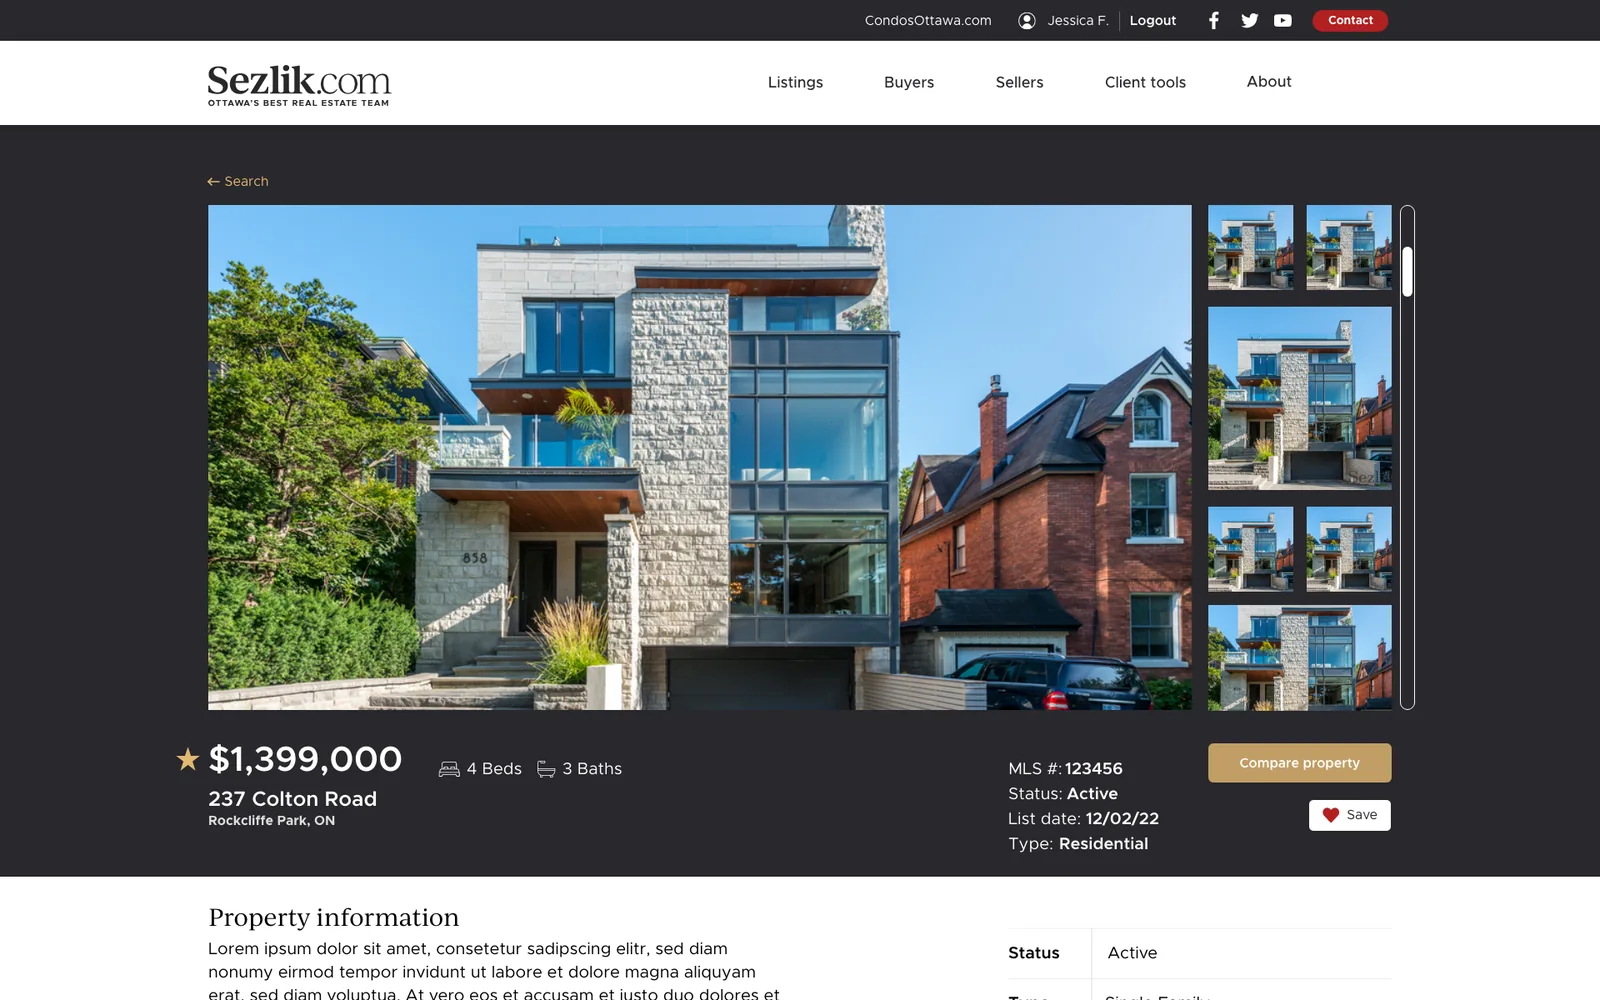
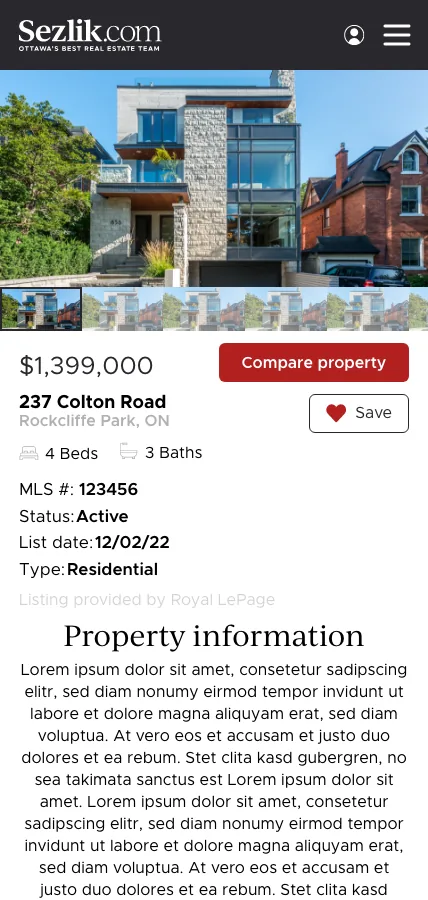
- Property pages for regular and luxury listings
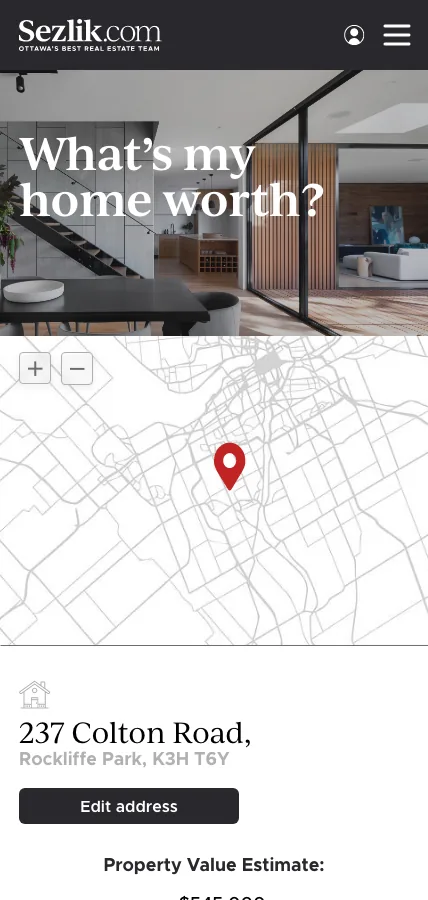
- A “What’s my home worth?” estimate tool for sellers
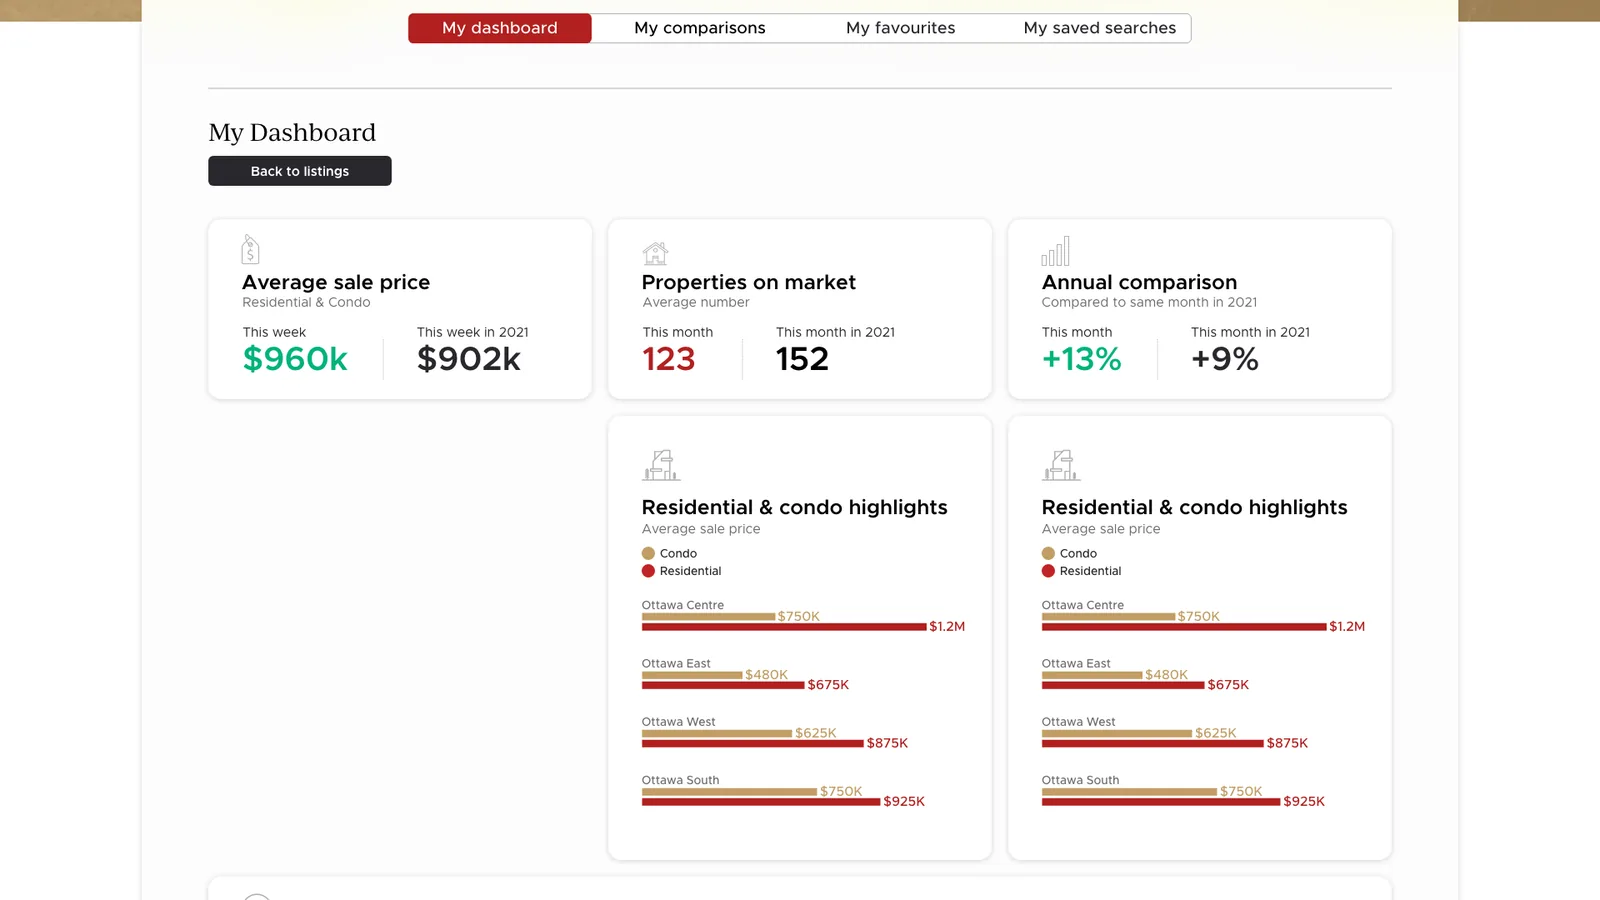
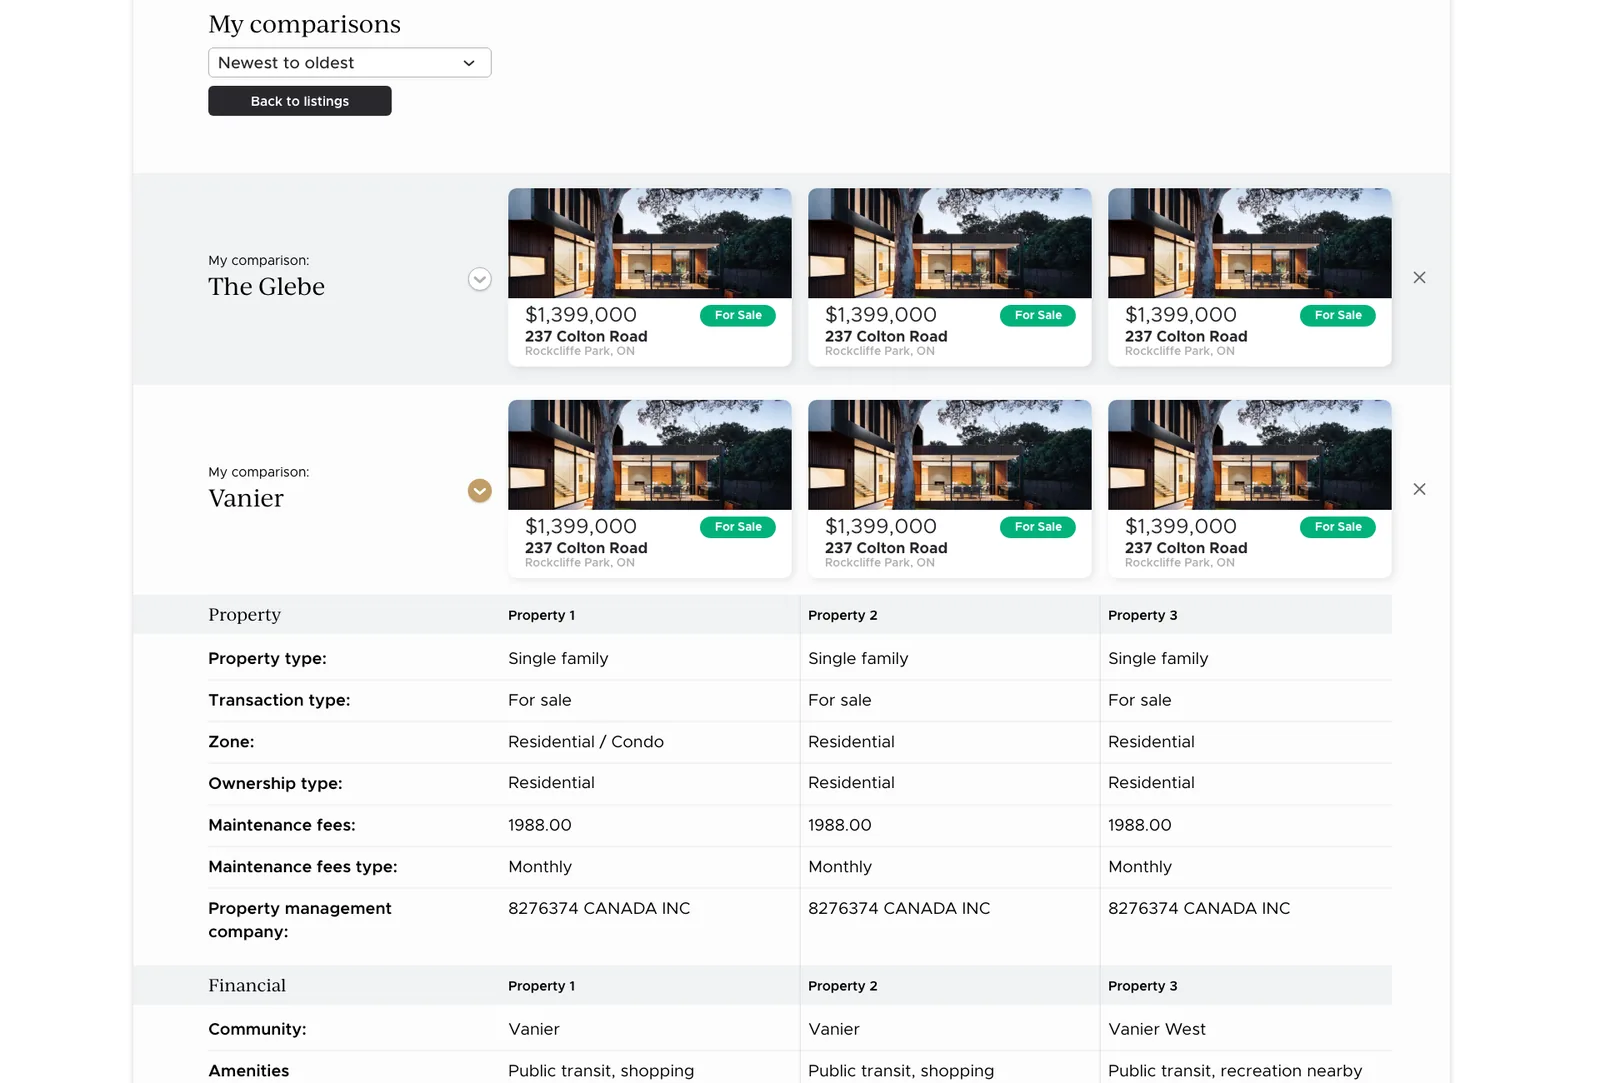
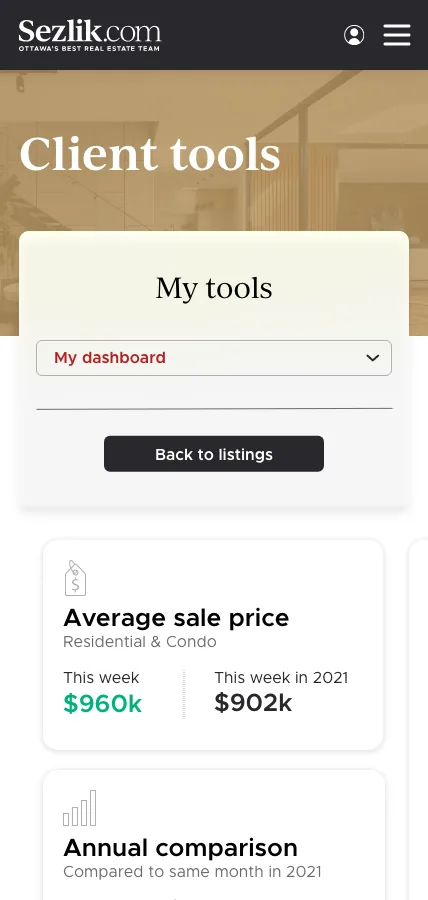
- Client tools: dashboard, comparisons, favourites and saved searches
The live site, in motion
Two minutes on sezlik.com as it runs today: the homepage search, the map, a property page with neighbourhood insights, the client dashboard, favourites, and a luxury listing with its virtual tour.
Pick a moment below to jump to it.
Service blueprint
Before any screens, I mapped the service as a whole: what the client does, what the site shows, what the team does behind it, and which systems carry the data. The blueprint showed where the site hands a client over to a person, and what the agent needs to know at that moment.
Scroll sideways to see all six stages →
Site flow
The site map follows two main paths: a buyer who searches and a seller who wants to know what their home is worth. Both end with a person on the team. Sign-up sits where it pays off for the client: sold prices, saving and comparing.
Enter
Explore
Decide
Sign-in gate
Come back
Contact
One search, three views
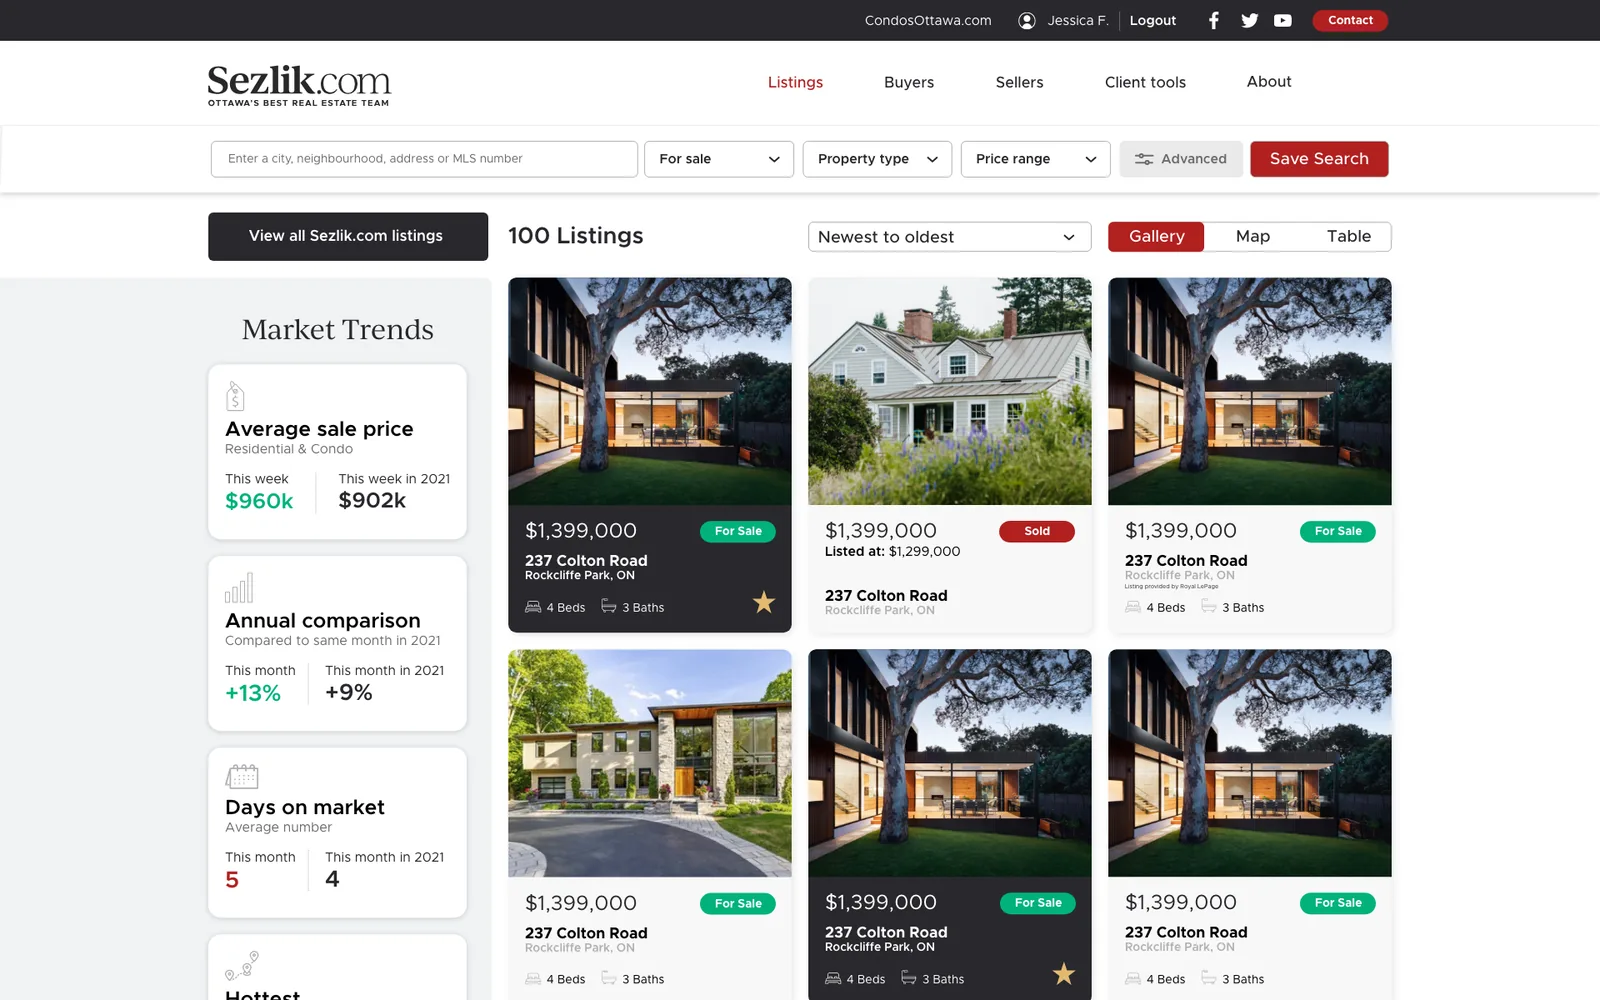
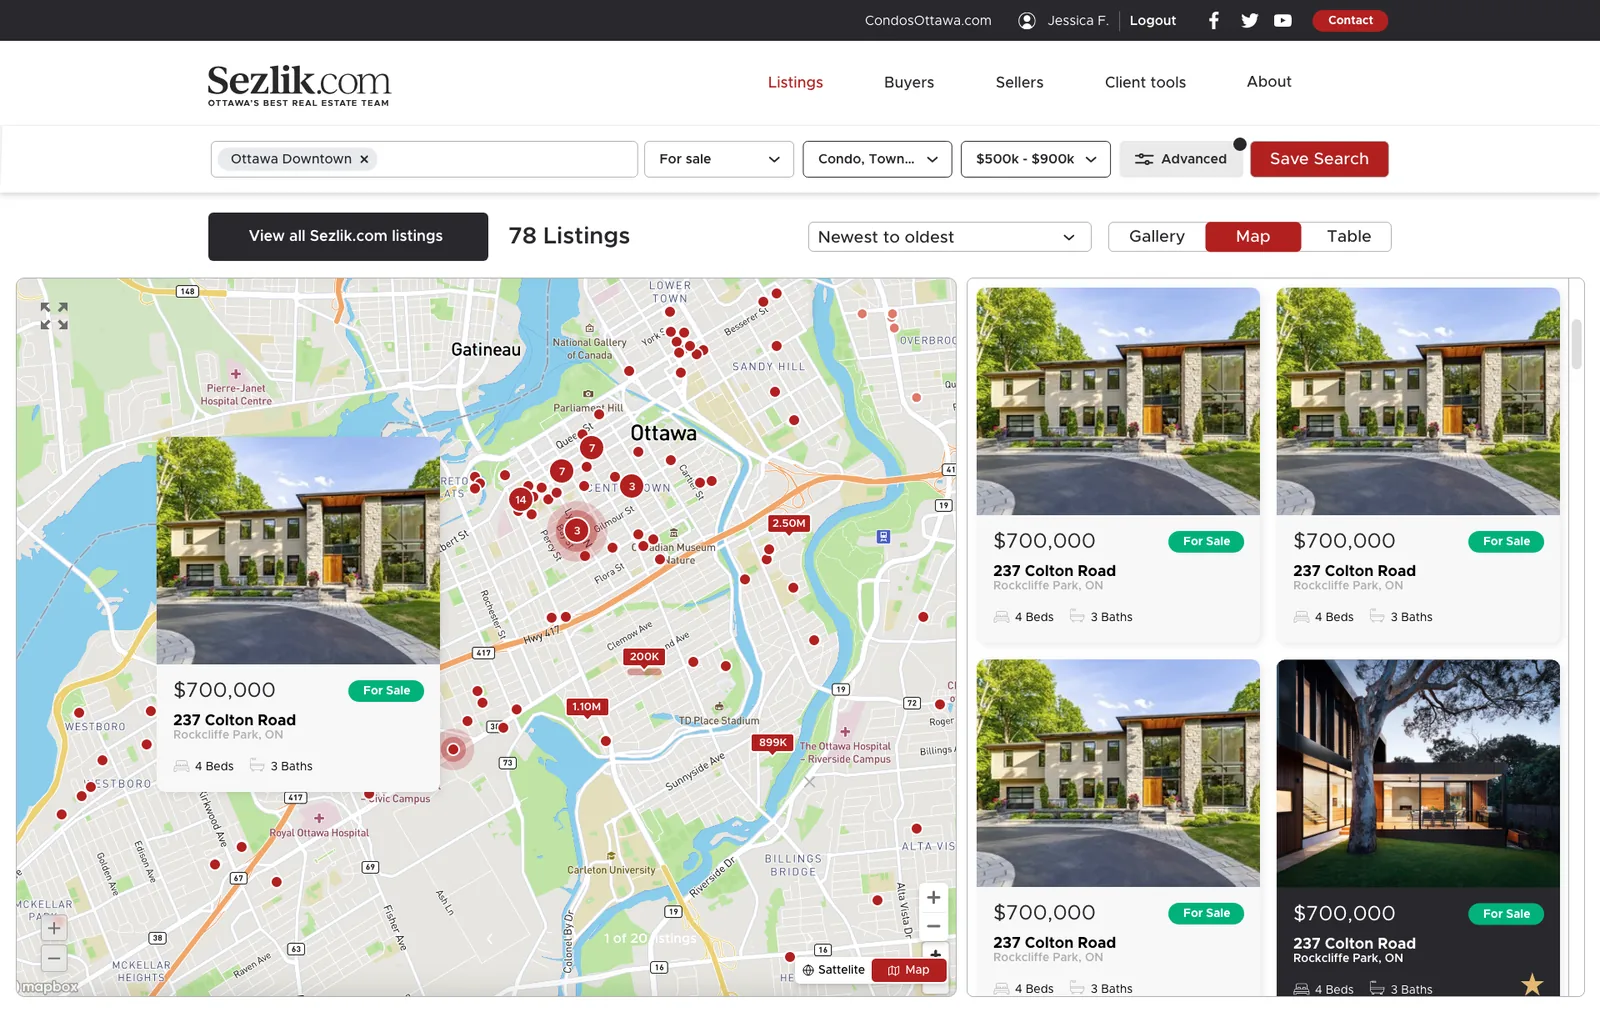
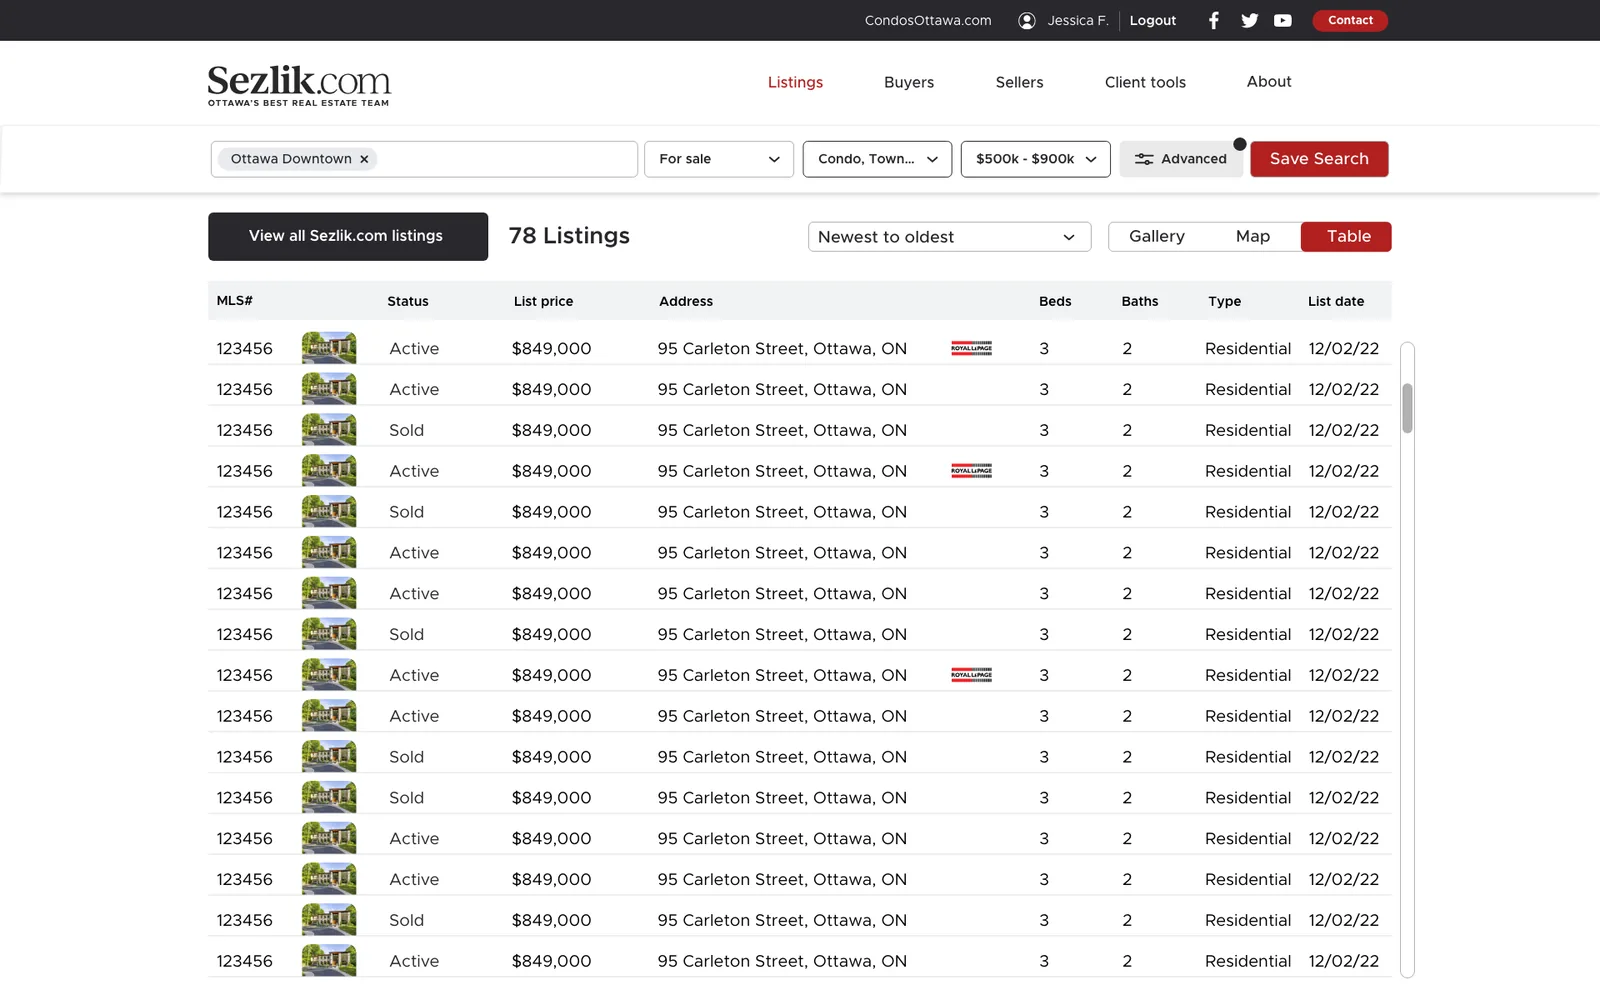
Gallery, map and table views sit under the same search bar and filters, so buyers can switch between browsing photos, scanning a neighbourhood and comparing numbers. Market trends stay beside the results.
Property pages, two moods
Luxury listings get a darker, more editorial page. The structure and actions stay the same on both: photo gallery, key facts, compare, save, an inquiry form and booking a viewing with the agent.
What’s my home worth?
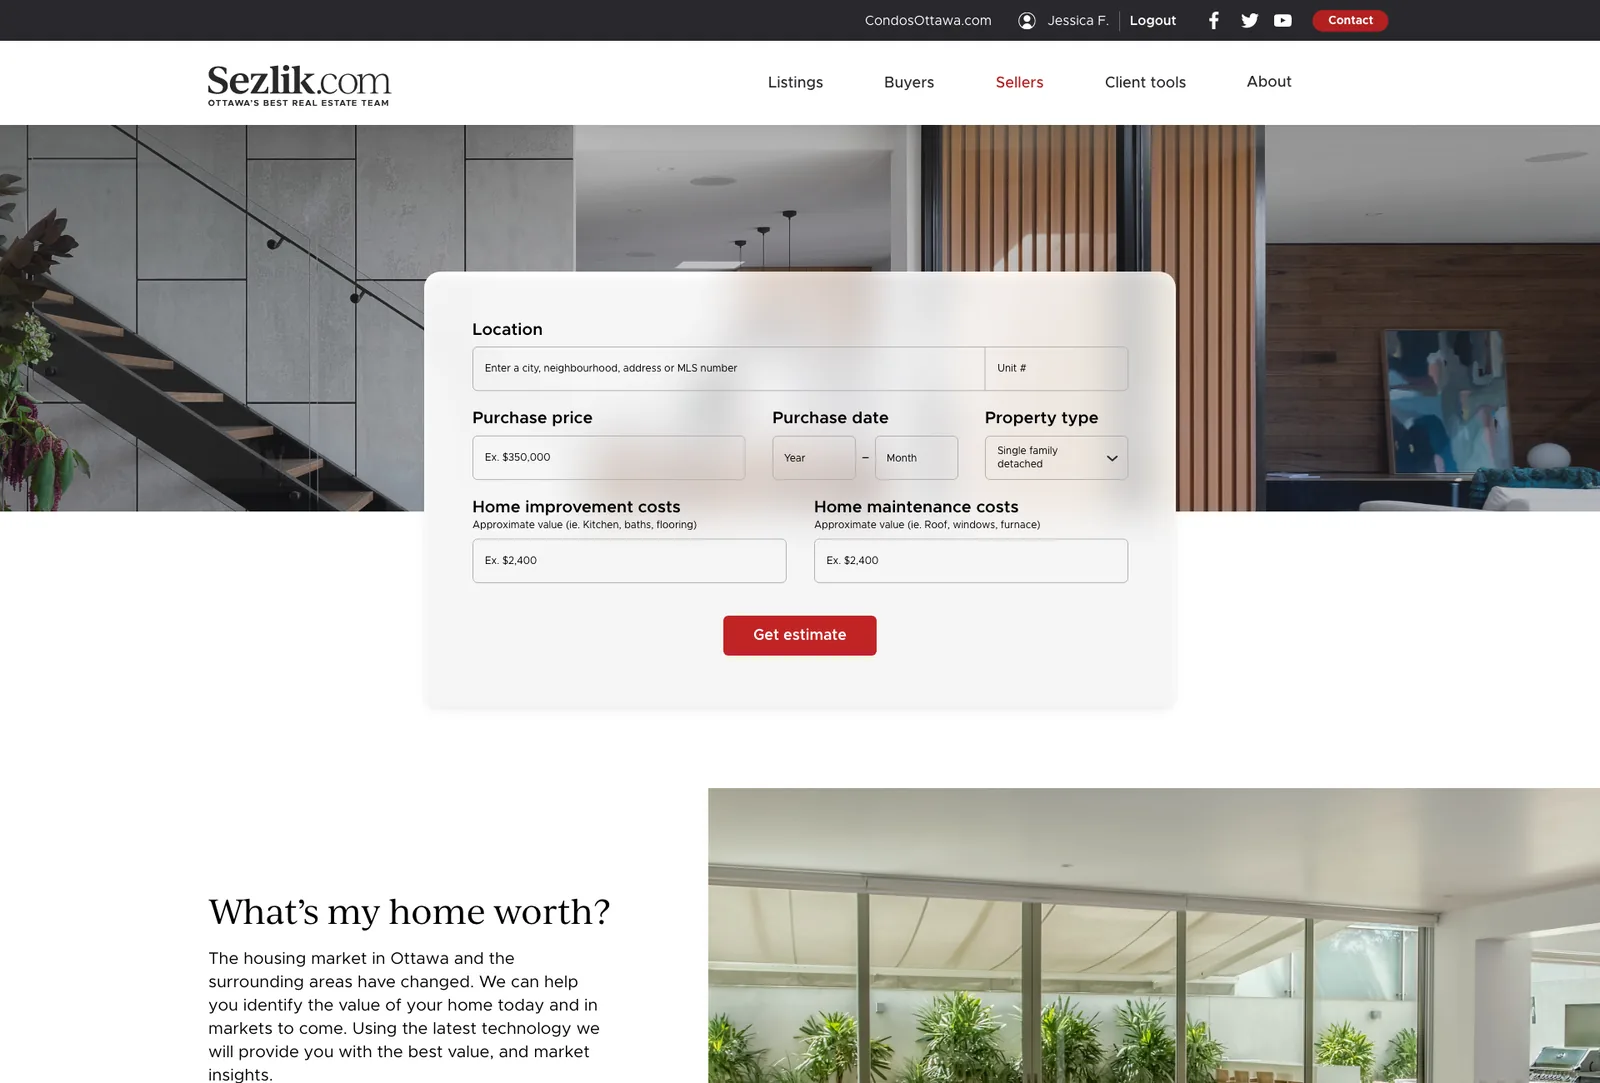
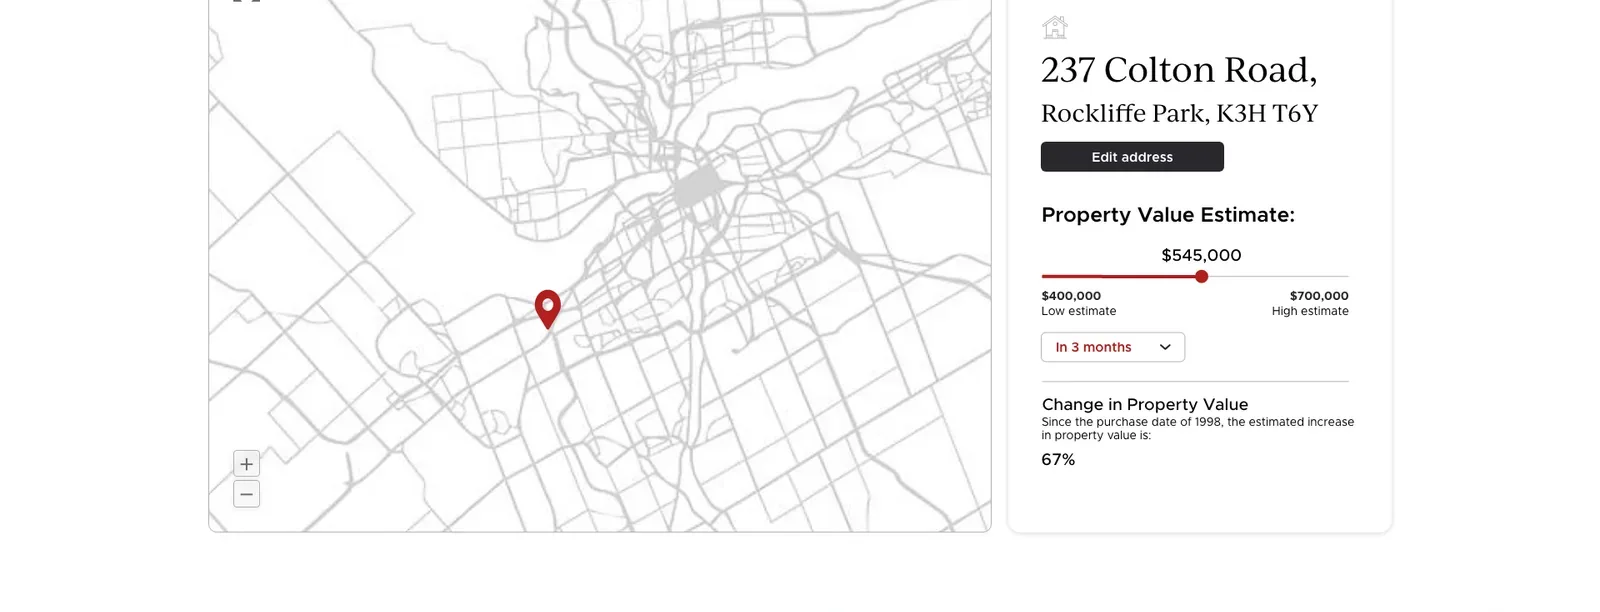
A tool for sellers. They enter the address, purchase price and date, and the cost of improvements. The result shows an estimate range, the change in value since purchase and a direct way to contact the team. For the team, every estimate is a seller lead with an address attached.
Analytics for two audiences
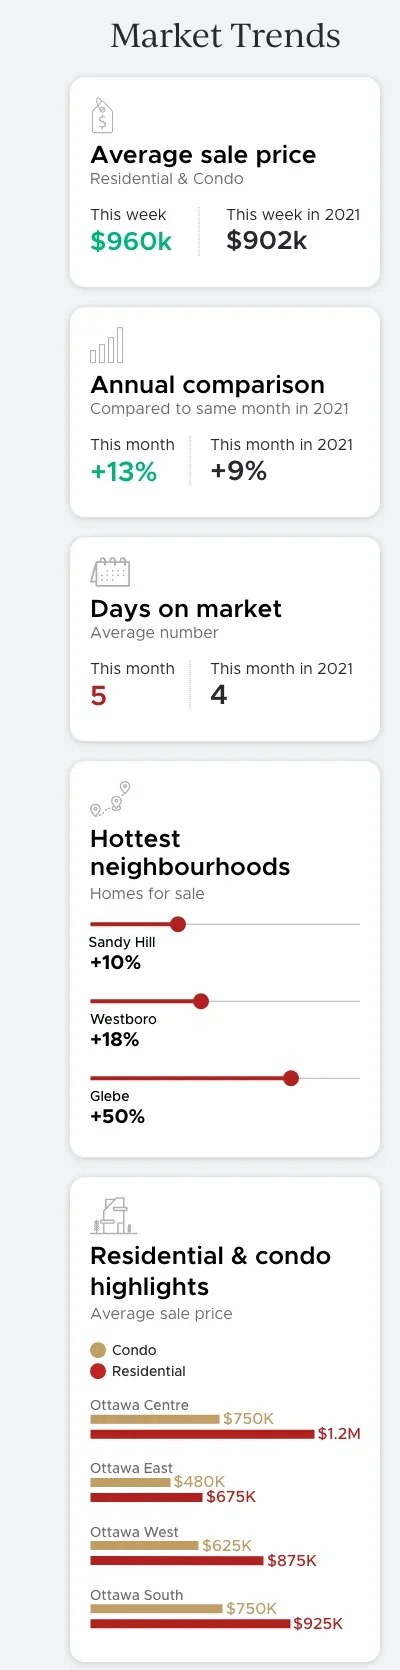
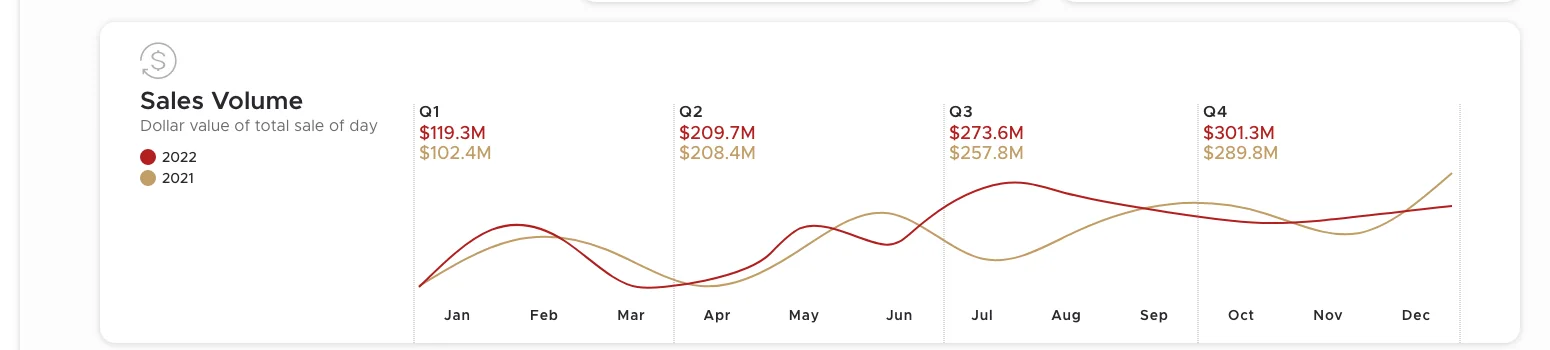
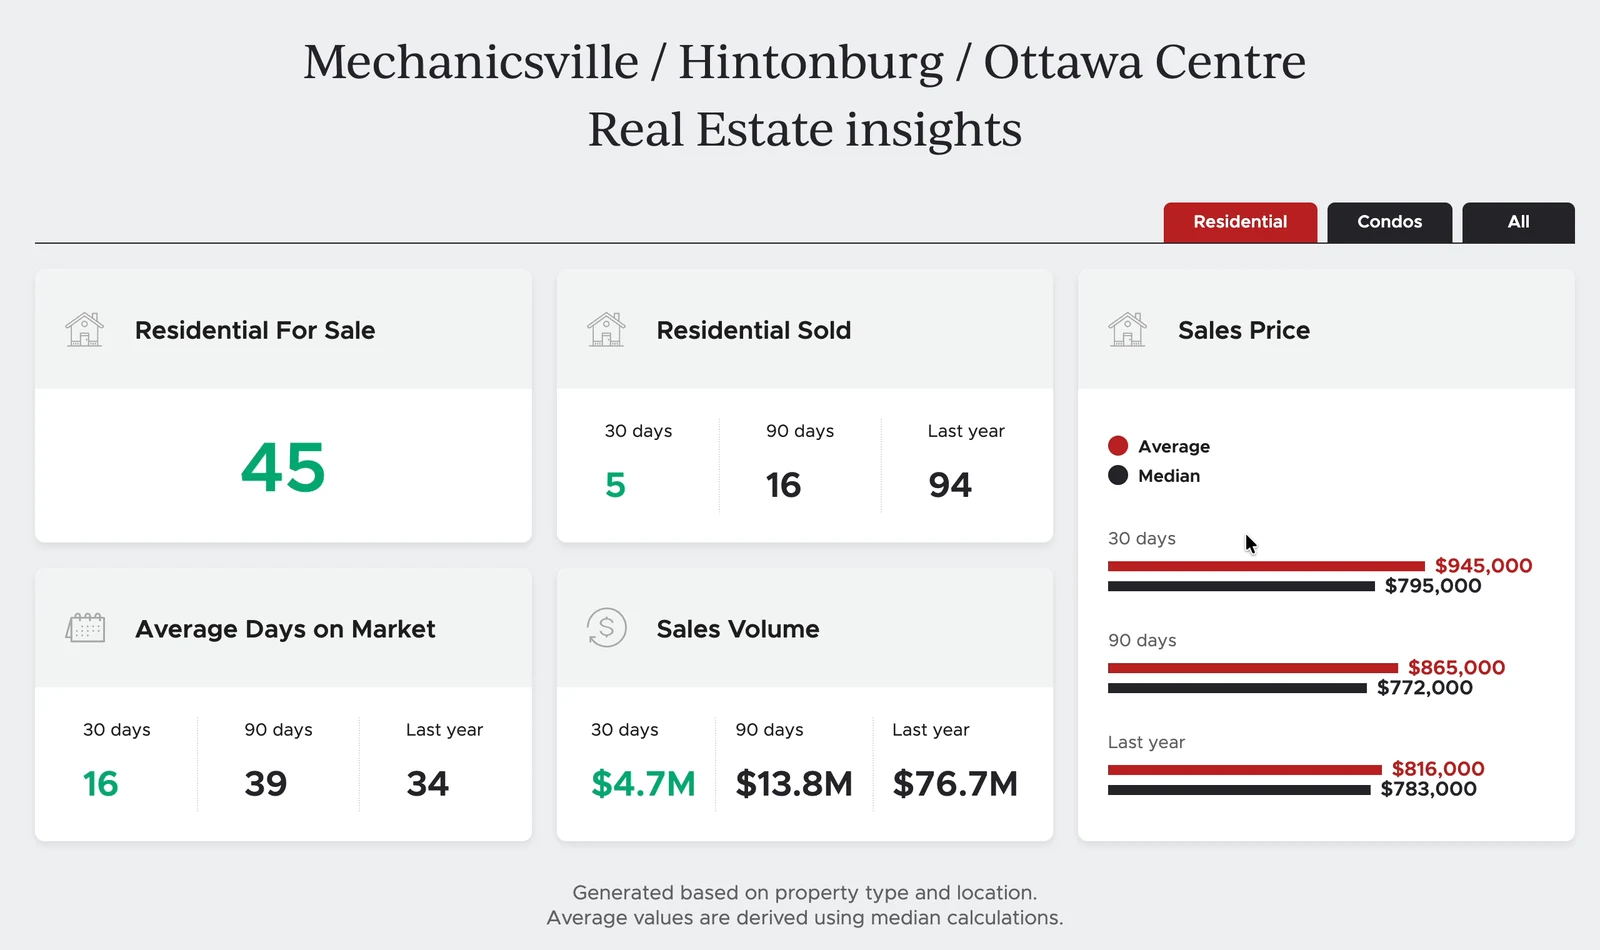
The site collects one set of data and shows it two ways. Clients see the market, so they can decide when and where to buy or sell. The team sees each client’s interest, so an agent calls with the right homes instead of a cold pitch. Every market number comes with a comparison period, so it reads as a trend.
Market data
- Average sale priceThis week compared with the same week last year
- Properties on market and days on marketThis month compared with last year
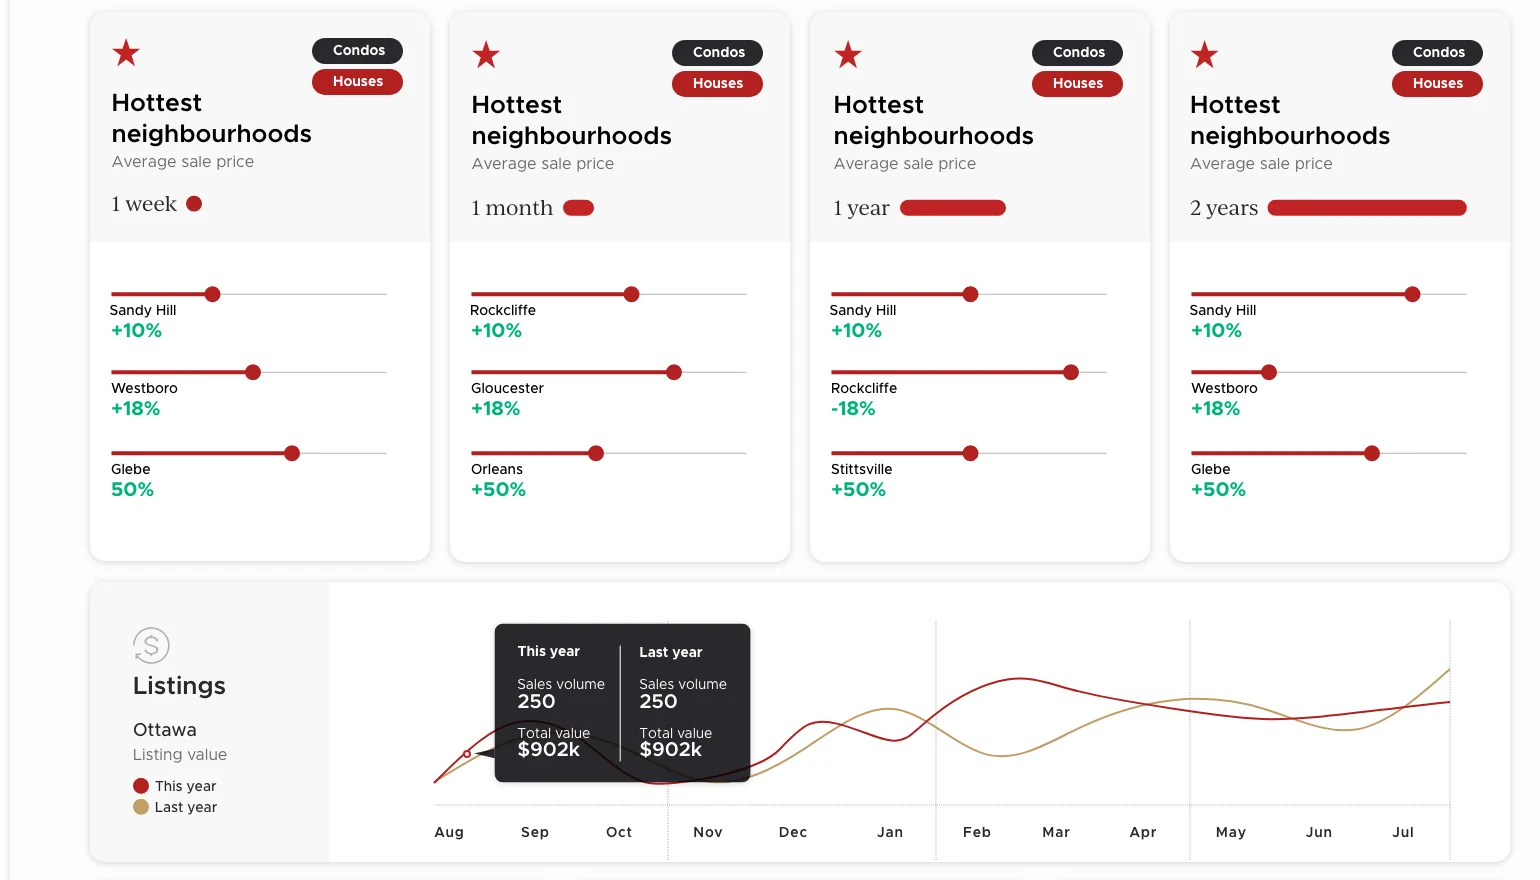
- Hottest neighbourhoodsPrice change over a week, a month, a year or two years
- Condo and house prices by areaOttawa Centre, East, West and South side by side
- Sales volume and listing valueMonth by month, this year against last year
Shown in
Homepage insights · market trends beside search · client dashboard · home value estimate
Client signals
- Saved searchesArea, price band and type each client is looking for
- Favourites and comparisonsThe homes a client keeps coming back to
- Home value requestsA seller lead with an address and purchase history
- Inquiries and viewing requestsA buyer ready to see a specific home
- Interest across the siteWhich areas and price bands draw the most attention
Arrives as
A lead with the client’s history attached, ready for the agent’s first call
↺ Every visit adds to the picture on both sides
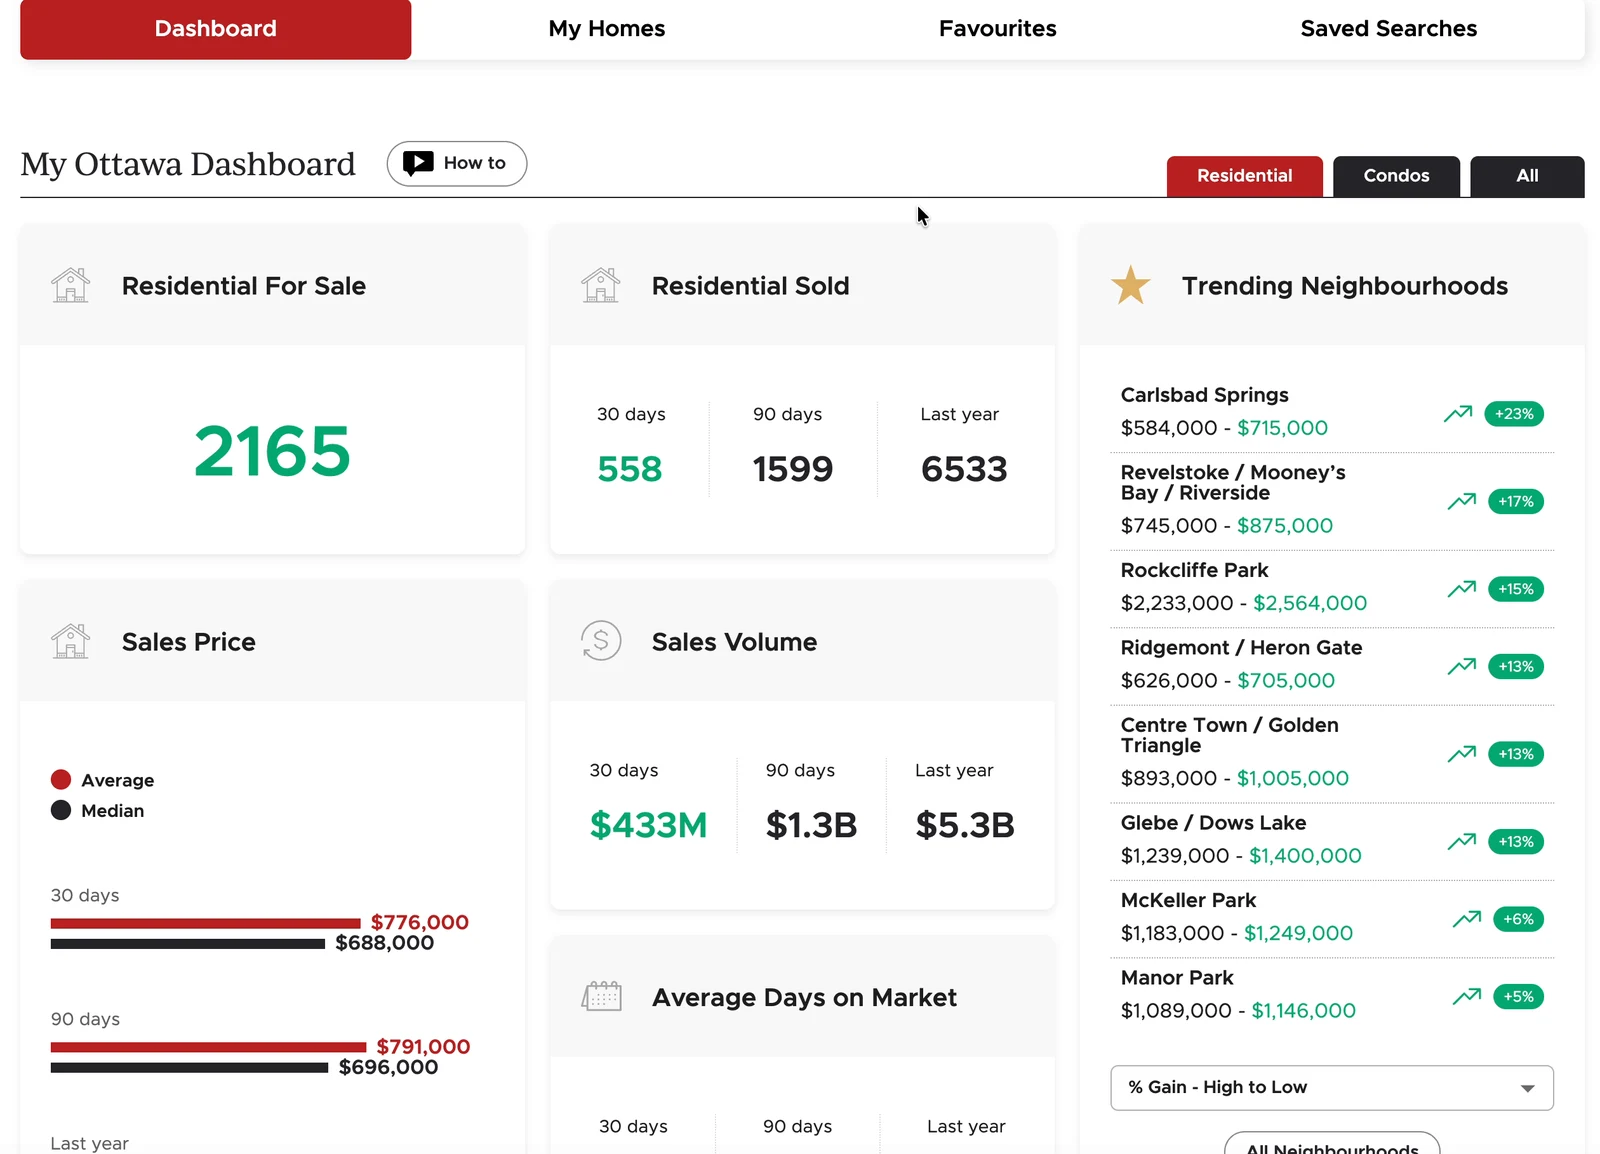
Every screen, three sizes
Each page was designed for desktop, tablet and phone, signed in and signed out. On the phone, search and filters collapse into one bar and the map works with a thumb.
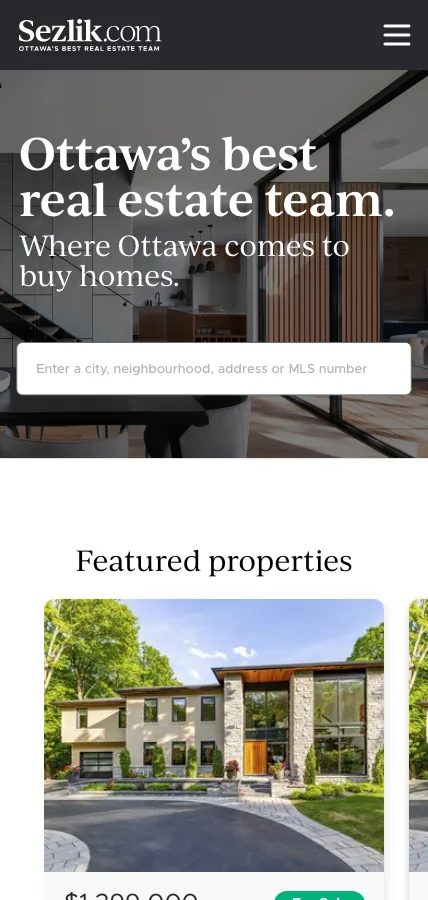
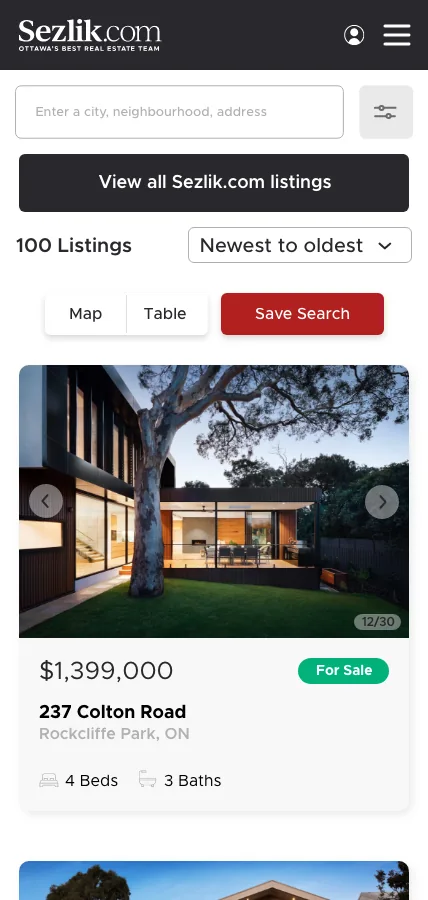
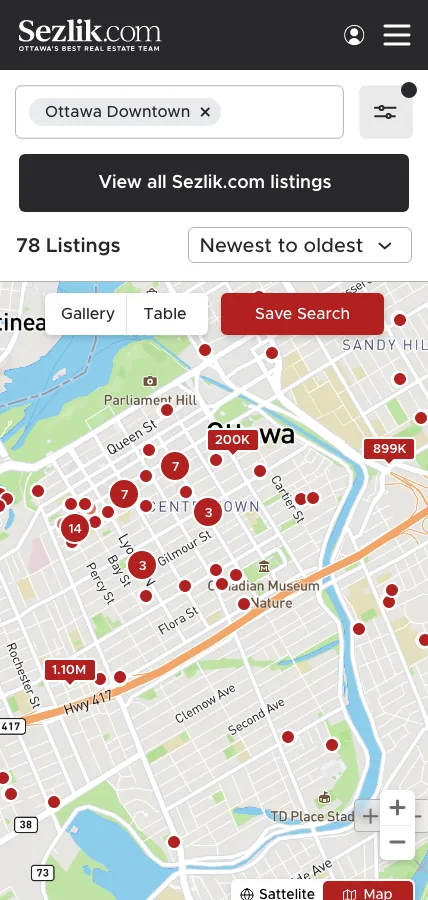
Phone · 428px
Outcome
A complete product designed end to end by one designer: the service behind it, every page and state, and the data model that serves clients and the team.
Next project
Hunkemöller